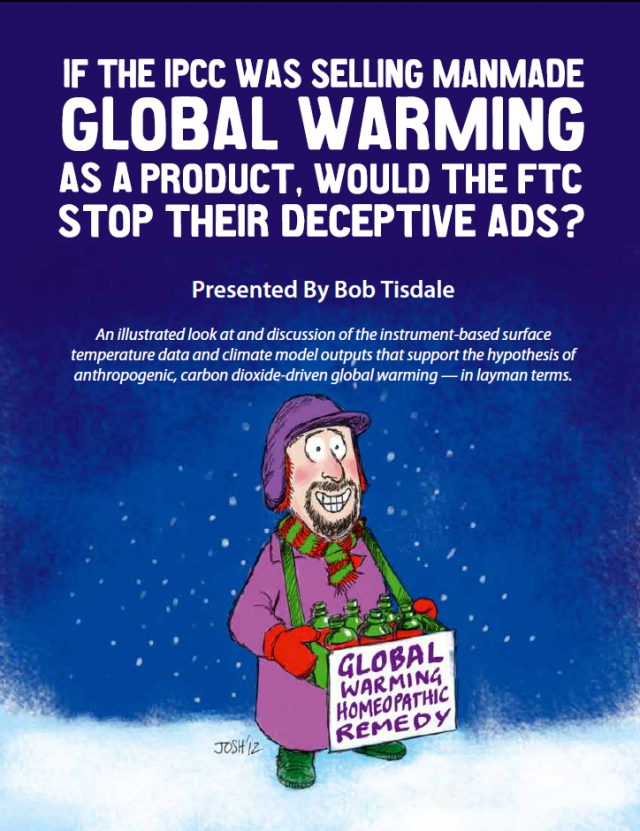
Dr. Geert Jan van Oldenborghs (zie KNMI.nl) favoriete speeltje is de KNMI Climate Explorer. Zeg hem dat de PDO het wereldwijde klimaat beïnvloedt en hij tovert zo een grafiek te voorschijn die het tegendeel bewijst. En nu maakt WUWT-scepticus Bob Tisdale van dit speeltje een hoeksteen van zijn sceptische e-book getiteld:
If the IPCC was Selling Manmade Global Warming as a Product, Would the FTC Stop Their Deceptive Ads?
Ruwweg vertaald is dat:
Als het IPCC AGW als product zou voeren, zou de reclame code commissie hun misleidende advertenties dan verbieden?
Interessante vraagstelling! Koop het boek nu voor $5 (via deze link) en je bent in een paar uurtjes volledig wegwijs in de KNMI Climate Explorer. Op die manier hebben we nog iets aan onze belastingcenten! Vanaf pagina 217 volgt een complete handleiding! Laat mij daar nu nog eens wat tijd voor vinden (omdat de olieindustrie ons zo rijkelijk betaalt) en dan zie je hier al snel prachtige zelfgemaakte klimaatgrafieken. Maar Bob Tisdale geeft iedereen al voor heel wat weekjes klimaatvoer.
Hieronder een copy paste van de opening notes…
Dear Readers,
This book does not present some new-fangled theory about manmade global warming. This is the story told by the instrument-based global surface temperature data and by the output data from the climate models used by the Intergovernmental Panel on Climate Change to simulate those global temperatures. I’m simply presenting the story told by the data and providing background information in layman terms to help you understand the story the data has been telling all along.
The book is based on my blog posts over the past three years at Climate Observations. Many of those posts have been cross posted by Anthony Watts at WattsUpWithThat, which is the world’s most-viewed website on global warming and climate change. I have, however, attempted in this book to present the discussions in very basic layman terms, where possible, with hope of making it easier to understand, especially by those without technical backgrounds.
Similar to my blog posts, I’ve kept many of the graphs at full page width. The reason: the data in the graphs, not my discussions of them, are what confirms or contradicts the hypothesis of anthropogenic global warming, or are what shows if the models can or cannot reproduce the rates at which global surface temperatures warmed and cooled over the 20thCentury. In a blog post, there are no page breaks, and page formatting is not a concern. The number of large graphs in this book, unfortunately, causes page formatting problems; only one graph at full page width will fit on a page. So there are pages with a graph and some text and blank space. If this book was a print version, the blank space would be a problem, but this is an ebook. The blank space doesn’t add to publishing costs.
Thank you for your interest in the topics discussed in this work. And, of course, my thanks to Josh of CartoonsbyJosh for the cover art.


Geef een reactie